The Wrangell Population Project

The census is more than a number — it’s a story. Since 1839, twenty different censuses of Wrangell have shown its growth and resilience over time.
Census Timeline
Getting an accurate census of Wrangell has always been challenging. Each census raises questions about who, where, and what Wrangell really is. There have been many estimates, guesses, and predictions about Wrangell’s population. Some of them are included here. But the chart above is a history of the censuses of what is today Wrangell.
Racial demographic data for Wrangell in 1960, 1980, and 1981 could not be found. On the 1970 Census results, Wrangell’s race was broken down into White, Black, and Other, with 437 identified as Other. Based on Wrangell’s historic trends, most of those people are likely Indigenous. Each census is also a time capsule of its era’s social attitudes and beliefs. How people identified themselves by race has changed over time, as well.
Whatever imperfections existed in the original census exist here, as well. In order to better explain this chart above, here are details about each of the censuses taken in Wrangell history.
1839 Census
Total: 1,430
Indigenous: 1,410 (99%) | European: 20 (1%)
When this census was taken in 1839, the Russian-American Company was actively engaged with leasing Redoubt Saint Dionysius to the Hudson Bay Company. For the Russians, the post was a strictly a place to trade furs with the Tlingit. A skeleton crew ran the operation, and nobody settled beyond the fort’s walls. They were surrounded on all sides by a Tlingit village, Ḵaachx̱ana.áakʼw. This census may have helped to inform discussions around the lease.
This census identified the clans as: Liknaahutly (S’iknax.ádi), Ta-ee-teeton (Teeyhittaan), Kvaskaguatee (Kaasx’agweidí), Kukatu, Naaaigh (Naanyaa.aayí), Talguatee (Taalkweidí), Kiksaetee (Kiks.ádi), Kadi-ettee. Adult men make up 32% of the population, while adult women are 29%. Boys make up 15%, and girls are 13%. Male slaves make up 4%, while female slaves are 6%.
As the wealthiest clan in the village, the Naan.yaa.áyi are recorded to have the most people in any category of adults, children, and slaves. Slaves may have been Tlingit or descended from other Indigenous tribes of the Pacific Northwest coast.
There are two clans, Kukatu and Kadi-ettee, whose names are not familiar. The names may have been unfamiliar to George T. Emmons and Frederica de Leguna, authors of The Tlingit Indians, who identify the Kukatu as “Wolf 26?” and the Kadi-ette as “Raven 28?” with question marks. Any research suggestions is appreciated.
1845 Census
Total: 1,426 (down by 4)
Indigenous: 1,408 (99%) | European: 18 (1%)
Around 1840, the Hudson Bay Company signed a 10-year lease to occupy the Russian trading post, renamed Fort Stikine (sometimes Fort Highfield). According to Roderick Finlayson, the Hudson Bay Company brought only 18 men to occupy the trading post. In 1845, the Hudson Bay Company performed a census of the village in modern-day Wrangell. Like the Russian survey from 1839, the census counted adults, children, and slaves by sex.
(source: From Fort Wrangel: Gateway to the Stikine by Patricia A. Neal)
The totals of the 1945 census closely align with the 1839 census. Once again, the census reported the Naan.yaa.áyi highest in each category, except in 1845 the Kayaashkiditaan counted more men (131) than the Naan.yaa.áyi (78).
1861 Census
Total: 697 (down 51%)
Indigenous: 697 (99%) | European: 2 (less than 1%)
Prior to this census, waves of epidemic disease spread through Indigenous communities along the coast. Smallpox was especially devastating to Indigenous communities, and Ḵaachx̱ana.áakʼw was not spared.
The Stikine Gold Rush of 1861 was Alaska’s first gold rush, and it changed everything. The fur trade was in decline, and Redoubt Saint Dionysius/Fort Stikine was a shadow of its former self. The gold rush brought hundreds of fortune-seekers, who disembarked before heading up the Stikine River. Estimates of the gold-seekers vary into the thousands, but it is clear that very few stayed behind when the summer ended. There are two European settlers who stayed and married Indigenous women: Charlie Brown and the man credited with discovering gold on the Stikine, Alexander “Buck” Choquette. The Russians performed a census of the Indigenous population of southeast Alaska in 1861:
Stakhine Settlement (near river of the same name): Men 308, Women 308. Slave Men 41, Slave Women 40.
Immediately following this census, the Smallpox Epidemic of 1862 would wreak havoc on the village population. According to historian James R. Gibson:
“Coming from California, it killed one-third of the Indians of the crown colony of British Columbia, including two-thirds of the Tsimshians. A ‘large number’ of Tlingits also perished, particularly on the Stikine, where they probably contracted the disease from the 3,000 to 4,000 American gold seekers who rushed to the river in the spring of 1862.”
1869 CEnsus
Total: 576 (down 18%)
Indigenous: 508 (88%) | European: 66 (12%)
This was the first census of the American Era, which began in October 1867 when Russian signed over its interests in Alaska to the United States. Less than a year later, in May 1868, the U.S. Army arrived near the north end of Wrangell Island to establish Fort Wrangel, one of several new Army posts in Alaska.
In October 1869, government agent Vincent Colyer performed a census of Ḵaachx̱ana.áakʼw. Where the Russians and the British counted by clan identification, Colyer counted by dwellings:
(source: The Colyer Report to the U.S. Congress of 1870)
While the British counted 64 lodges in 1845, Colyer counted 32 — exactly half as many homes. Every house had at least one child, and seven houses had at least 10 or more children. The average house had 16 residents, and there were nine houses with 20 or more people.
To calculate the number of European settlers in Wrangell during Colyer’s census, we can look to the U.S. Army Post Returns. For October 1869, there were 56 officers and soldiers stationed inside Fort Wrangel. Due to the details included in the Bombardment of Wrangell story, we know there were eight additional settlers, namely Army families and merchant traders.
The Bombardment of Wrangell proved a fiasco, and the U.S. Army officially abandoned Fort Wrangel before the end of 1870. According to a passage in Wrangell and the Gold of the Cassiar by Clarence Andrews, in the spring of 1873 the only white men in Fort Wrangel were William King Lear, Deputy U.S. Customs Officer David Flannery, and a holdover from the 1861 Gold Rush, Charles Brown. That changed in 1874, as the Cassiar Gold Rush brought merchants, miners, and Indigenous people from miles around to Fort Wrangel on their way up the Stikine. The Cassiar Gold Rush also brought back the U.S. Army, which occupied Fort Wrangel again from September 1874 to June 1877.
1880 Census
Total: 422 (down 27%)
Indigenous: 317 (75%) | European: 105 (25%) | Creole: 1 (less than 1%)
The U.S. Army abandoned the garrison of Fort Wrangel in 1877, handing over control of some of the buildings to Presbyterian missionaries. By 1880, the Cassiar Gold Rush was about played out. The 1880s began with a bang, when a violent conflict erupted outside the northern walls of the fort, in a region known as the Foreign Town. Several Christian Tlingit men were killed, and the out-of-town Indigenous people in the Foreign Town fled. The 1880 Census is a snapshot in time, immediately after the bubble burst.
The 1880 Census of Alaska was performed by Ivan Petrov, whose accuracy has been debated by historians for many years. To learn more about why Ivan Petrov lists the village as being on Etholin Island, read our blog, When Wrangell Island Was Called Etolin Island.
Stakhin tribe. Shustak’s Village (38), Kash’s village (40), Shakes’ village (38), Towayat’s village (82), Kohltiene’s village (28), Hinauhan’s village (31), Kadishan’s village (27), Shallyany’s village (24).
(Wrangell Only) Whites and Creoles of Wrangell: 106 Total. 105 White, 1 Creole.
The numbers of the Naan.yaa.áyi, who had been the most numerous in past decades, are greatly diminished in this census. Towayat’s village has the most members (82) by far, which is notable because it is T’owyaat who embraced the earliest Christian missionaries, fostered their growth within his family, and who was killed at the beginning of 1880 in the conflict in Fort Wrangel.
1890 CEnsus
Total: 316 (down 25%)
Indigenous: 227 (72%) | European: 88 (28%) | Other: 2 (less than 1%)
By 1890, Fort Wrangel was one of Alaska’s leading cities. It split the year with Sitka as the site of Alaska’s only federal courthouse. Salmon canneries began taking, and reshaping, the landscape socially and economically. Steamships from British Columbia, Washington, and down the coast brought occasional gold-miners, and tourists provided a new source of revenue.
Tragically, the paper records of the 1890 Census were completely destroyed by a fire, leaving historians to forever question this period of history. Thankfully, a summary report from Alaska survived:
Wrangell only: Total 316. White Native Male 38, Female 15. White Foreign Male 32, Female 8. Chinese 1. Indian Native Male 104, Female 99. Indian Foreign Male 11, Female 13. Number of Persons of School Age (Five to seventeen years) White Male 6, Female 3. Indian Male 27, Female 20. (source: Census Bulletin, No. 30, February 11, 1891)
(Wrangell only) Able to Read and Write Total 117. White Native Male 31, Female 11. White Foreign Male 31, Female 2. Indian Native Male, 17, Female 15. Indian Foreign Male 5, Female 5. Able to Speak English Total 158. White Native Male 35, Female 12. White Foreign Male 31, Female 2. Indian Native Male 36, Female 30. Indian Foreign Male 6, Female 6.(source: Census Bulletin, No. 30, February 11, 1891)
The 1890 Census also reported 84 pupils in the Fort Wrangell Public School, with an average daily attendance of 40, and number of days taught 200. The census also reported were 65 men of voting age, of which 28 were born U.S. citizens, while 18 were foreign born.
1900 Census
Total: 868 (up 174%)
Indigenous: 364 (42%) | European: 434 (50%) | Other: 70 (8%)
The 1900 Census marked the first census in which people of European descendant outnumbered the Indigenous in Wrangell. The 1900 Census took place during the boom of the Klondike Gold Rush. Steamships full of gold-seekers disembarked at Fort Wrangel before heading up the Stikine River for the Klondike. Like the 1861 census, this census almost certainly ignores most of these gold-seekers, as their time in Fort Wrangel was short and never permanent.
This period is noteworthy, for it marks the third and final time the U.S. Army occupied Fort Wrangel. In April 1899, a detachment of African-American soldiers, known throughout history as the Buffalo Soldiers, were included on the 1900 Census for Fort Wrangel. You can read more here: Fort Wrangel’s Buffalo Soldiers on the 1900 Census.
This chart shows the number of men occupying Fort Wrangel for the Army. The first detachment came in May 1898 and handed over control to the Buffalo Soldiers in April 1899:
1910 Census
Total: 743 (down 14%)
Indigenous: 189 (34%) | European: 419 (56%) | Other: X (10%)
In 1903, Fort Wrangel officially incorporated into the City of Wrangell. The community developed electrical lights, a telegraph line to the outside world, and a newspaper to cover it all. Still, the population declined slightly from its boom period during the Klondike Gold Rush. By 1910, Wrangell was one of only fourteen incorporated cities in Alaska.
Edited to show (Stikine Only) Total 189. Male 96, Female 93. Full-Bloods Total 150. Mixed Bloods 39.
In the past, census takers counted the number of Indigenous people by clan group. By 1910, the federal government asked more broadly which tribe they belonged to. The 1910 Census data may be the first record we have of a racial group in Wrangell that would become more prominent: Mixed.
1920 Census
Total: 821 (up 10%)
Indigenous: 240 (29%) | European: 533 (65%) | Other: 48 (6%)
In 1920, Wrangell and the nation emerged from World War I ready to build at home. It was an era of opportunity for some, racial segregation for others, with political tensions leading to a tipping point. The community was the mixture of two extremes. There were Tlingit people old enough to remember when the Army arrived to build the fort. At the same time, there was a generation reaching adulthood that had always known Wrangell as a white majority town.

From a Bulletin published by the Department of Commerce on Alaska’s population.
According to this census, “No attempt was made at the Fourteenth Census to classify Indians by tribe, as was done at the Thirteenth Census by means of a special schedule for Indians…”
1930 Census
Total: 1,002 (up 22%)
Indigenous: 285 (27%) | European: 687 (65%) | Other: 55 (3%)
By 1930, it was clear that the rest of southeast Alaska’s population was pulling ahead of Wrangell. This is also the Census’ first reference to the “Wrangell district.” In 1920, the census measured “Wrangell town.” In the future, the U.S. Census would report both. To clarify, the word “Native” on this census does not mean Native American; rather, it refers to someone born inside the United States.
Wrangell District: Total 1002, Male 667, Female 395. White 687, Indian 285. Native White Total 286, Foreign or mixed par. 297, Foreign-born white 194. Age Under five 82, five to fourteen 138, fifteen to twenty-four 156, twenty-five to thirty-four 130, thirty-five to forty-four 153, forty-five to sixty-four 253, sixty-five and over 80, twenty-one and over (including unknown) 680.
According to the 1930 Census, “An attempt was made at the Fifteenth Census to classify the Indians of Alaska according to the tribes forming the various linguistic stocks. However, the answer to the inquiry concerning tribe were so incomplete that the data have been omitted in this publication.”
In 1937, the Bureau of Indian Affairs in Wrangell conducted a census of the town’s Alaska Native population: 1937 Part 1 1937 Part 2
1940 Census
Total: 1,162 (up 16%)
Indigenous: 398 (34%) | European: 762 (62%) | Other: 38 (3%)
While the 1940 Census was technically administered in late 1939, it is still found in the 1940 U.S. Census collection. For the first time, the Census separated the Wrangell District into Wrangell Town (1,162), Wrangell Village (163) and Olive Cove on Etolin Island (11). The physical boundaries of Wrangell Town were small, such that many people made their homes on Wrangell Island outside of the city limits.
This census also marks the first census since the Wrangell Institute opened. While staff appear on this census, the Wrangell Institute students were not included. In 1940, BIA officials operating out of the Wrangell Institute conducted a 1940 census of Wrangell’s Alaska Native people.
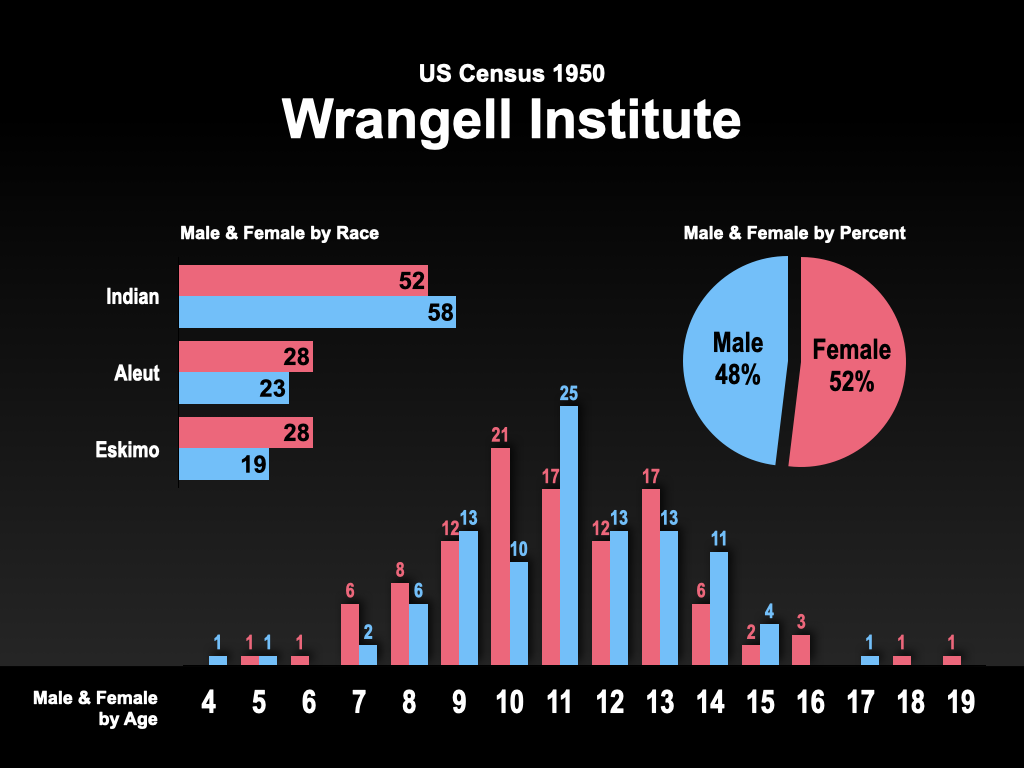
1950 Census
Total: 1,263 (up 9%)
Indigenous: 382 (30%) | European: 838 (66%) | Other: 43 (4%)
While the town’s population was 1,263, the Wrangell District reported 1,668 people.
Census years from left to right: 1950, 1939, 1929.
The students attending the Wrangell Institute appear by name on the 1950 Census for Wrangell. Based on the demographic information for each student, we can create charts to visualize some details about these students:
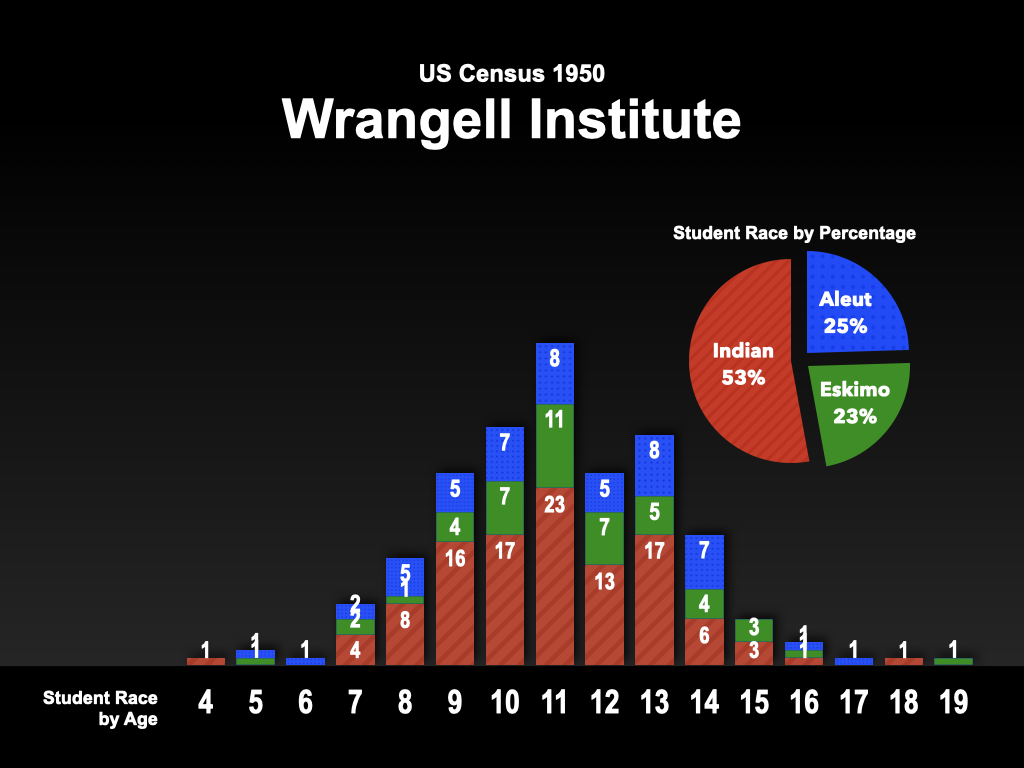
To learn more about the Wrangell Institute, please visit Researching the Wrangell Institute.
1960 Census
Total: 1,315 (up 4%)
Demographic data not available at this time
Alaska became a state on January 3, 1959, making this the first U.S. Census of statehood. This era marked the Cold War between the United States and the USSR, but Wrangell thrived with a sawmill and the Wrangell Institute boarding school to ensure employment within the community.
From the November 25, 1960 Wrangell Sentinel: Wrangell Given 1,315 in Official Census Count. Wrangell’s population has been officially listed as 1,315, according to the U.S. Bureau of the Census. Anchorage is listed as the largest town in Alaska with a population of 43,412. Fairbanks is second with 13,311.
Around this time, the U.S. Census and many government agencies began reporting on Wrangell as a combined Wrangell-Petersburg district, which sometimes even included communities like Kake. Because the data is combined and reported as one value, it is often difficult to report a specific value for a specific community.
1970 Census
Total: 2,429 (up 85%)
European: 1,592 (66%) | Black: 2 (less than 1%) | Other: 435 (18%)
This is the single largest leap in Wrangell census history. This growth occurred in the first decade of Alaskan statehood. The sawmill in Wrangell expanded its business, allowing it to hire more people. Aviation was changing life in small town, rural Alaska, as construction of an airport on the north end of Wrangell Island commenced in 1969. This was a population boom for Wrangell, but confusion about who was included in the count would derail the 1980 census.

(Edited to show Wrangell Only) Total Male 1055, Female 974. Race White 1592, Negro 2, Other 435. Age Median 24.8, Percent under eighteen years 40.7, Percent sixty-five years and over 4.5, in group quarters 22, Households Total Number 606, Population 2007, Persons per house-hold 3.31, Negro and other races number 89, Population 431, Persons per household 4.84.
The demographic table for the 1970 Census reports three races: White (1,592), Negro (2), and Other (435). It’s unclear exactly who is inside of “Other,” but given Wrangell’s historic census patterns, it is most likely to be Alaska Native/Native American.
1980 Census
Total: 2,184 (down 10%)
Demographic data not available at this time
In 1975, the City of Wrangell expanded the city limits, stretching further across Wrangell Island to absorb more homes and people into its reach. The City thought it had added 800 people to its population in one fell swoop and boasted a population over 3,000. Newspapers, travel guides, and even state reports repeated it. But it was all a mistake, exposed by the 1980 Census.
(Wrangell Only) The Wrangell Census Subarea was 2,363, while Wrangell City was 2,184.
In 1980, the US Census Bureau released its preliminary count for Wrangell: 2,174. The City rebuffed the Census Bureau and reported, by its own estimates, Wrangell had a population of 3,325. The two sides debated, and the Census Bureau agreed to add ten names to the total, bringing the town’s population to 2,184, but far short of closing the gap.
The city government stood to lose tens of thousands of dollars in state and federal funding using the lower figure. The City of Wrangell sued to challenge the total. For a time, it seemed as if Wrangell might have two official population totals: one used by the federal government (2,184) and one used by state government (3,325).
The city government argued that it added 800 new people in 1975 when it expanded the city limits, absorbing more homes and people into its count. On investigation, it was determined than many of these people had actually been counted in the 1970 Census. Consequently, the claim of adding 800 new people to Wrangell’s population in 1975 was far too high. The US Census Bureau’s figure of 2,184 stood as the official count. You can read more about the 1880 Census of Alaska in the 1980 General Social and Economic Characteristics of Alaska.
1981 Census
Total: 2,345 (up 7%)
Demographic data not available at this time
In 1981, the City of Wrangell completed its own census and reported a population of 2,345 — a difference of 161, but still far short of 3,325. The Wrangell Institute boarding school shut down in 1975 and may have contributed towards some of the town’s diminished population, as well.
The mistake over Wrangell’s actual population lives on, as records and publications from the past promote the idea that, at one point in the 1970s, Wrangell’s population rose above 3,000, only to decline by a thousand in the decades since. In fact, Wrangell’s population has been much more stable than that.
1990 Census
Total: 2,479 (up 6%)
Indigenous: 496 (20%) | European: 1,954 (79%) | Hispanic: 41 (1%) | Black: 18 (less than 1%) | Others: 3 (less than 1%)
1990 is the highest reported census in Wrangell history at 2,479, slightly above the boom of 1970. It is also the most Indigenous people living in Wrangell (496) since Vincent Colyer’s census (508) in 1869. By 1990, Wrangell’s economy was a mixture of natural resources and tourism. As one of Alaska’s oldest colonies, Wrangell embraced its identity as a gold rush town as much as it celebrated totems and Indigenous art for tourists. Wrangell was connected to the outside world through airwaves and satellites. Ferries, jets, and floatplanes took travelers in all directions. On the horizon, legislation threatening to end timber in the Tongass made headway through Congress and to the President’s desk.
(source: Alaska Population Overview, 1990 Census and Estimates, Alaska Department of Labor)
(source: Alaska Population Overview, 1990 Census and Estimates, Alaska Department of Labor) This is from the 1990 Census, broken down to show Wrangell Census Subarea by race.
Like the 1980 Census, the City of Wrangell once again complained that it had been undercounted. According to the February 28, 1991 Wrangell Sentinel, a state study put Wrangell’s 1989 population at 3,112. According to the article, the City considered filing a complaint with the Census Bureau, but it missed the deadline to file its appeal. You can read more about Alaska’s population 1990 in the 1990 General Housing Characteristics of Alaska.
2000 Census
Total: 2,308 (down 7%)
Indigenous: 358 (16%) | European: 1,696 (73%) | Mixed: 225 (10%)
The year 2000 marked a millennial milestone, but an uncertain future for Wrangell. In the previous quarter-century, the town lost the Wrangell Institute and the sawmill. The loss of two large employers hurt the local economy. Meanwhile, the expanding availability of home internet service changed the way Wrangell began to communicate with each other and the world. 2000 marked the election of President George W. Bush, who earned 797 votes (78%), a record high in Wrangell national politics.
You can learn more about the 2000 Census of Wrangell in Alaska: 2000 Summary Population and Housing Characteristics.
2010 Census
Total: 2,369 (up 3%)
Indigenous: 379 (16%) | European: 1,706 (72%) | Mixed: 223 (9%) | Asian: 33 (1%)
The 2010 Census marked the first census taken after Wrangell became a Borough in 2008. This assured that Wrangell would have its own census area, separate from the newly created Petersburg Census Area. This map shows the Wrangell City and Borough 2010 Census Tract 1:
The QuickFacts for 2010 contain more information about age, sex, race, housing, and more.
2020 Census
Total: 2,127 (down 10%)
Indigenous: 359 (17%) | European: 1,393 (66%) | Mixed: 274 (13%) | Asian: 72 (3%) | Black: 23 (1%)
The 2020 results came as a surprise to Wrangell’s city government. They expected a much higher figure. The task of administering the U.S. Census in 2020 was made more complicated by the COVID-19 lockdown, contributing to questions of accuracy. The August 19, 2021 Wrangell Sentinel reported that Wrangell Economic Development Director Carol Rushmore said, “We’re very concerned that the numbers are inaccurate… We’re trying to understand if there is any recourse, trying to understand if we can appeal… The question is, was everybody really counted?”
The US Census Bureau has provided more information at Alaska 2020 Census and the 2022 Economic Conditions Report.
Future Projections
In July 2024, Alaska’s Department of Labor & Workforce Development published Alaska Population Projections. The report states that it made its projections “based on historical population data and rates of fertility, mortality, and migration” but acknowledges “Alaska is susceptible to many unpredictable events and that no demographer or economist can foresee the future.”
The report singles out Wrangell several times. For every 1,000 people in the City and Borough of Wrangell, there are 14.1 deaths — placing Wrangell second behind the Yukon-Koyukuk Census Area (14.4). The report continued, “The boroughs/census areas projected to have the highest levels of average annual population loss over the period are the City and Borough of Wrangell (-1.5 percent), the Kodiak Island Borough (-1.0 percent) and the City and Borough of Sitka (-1.0 percent).”
If the Department of Labor & Workforce Development’s prediction is true, there will be 1,349 people living in Wrangell in 2050 — less than there were in 1839 (1,430) and 1845 (1,426).
Creating an accurate census of the present moment is difficult, but predicting the census into the future is even more challenging. Frequently, the U.S. Census does not match up with state or local figure for Wrangell’s population. In this Snapshot of Wrangell’s Economic Picture, you can see in 2000, the state predicted 2,569, but the US Census counted 2,308 (261 fewer). In 2010, the state predicted 2,058 in the Wrangell borough, but the US Census counted 2,369 (311 more). In 1969, the Alaska State Housing Authority published the Wrangell Comprehensive Development Plan, which predicted Wrangell’s future population “will be close to 4,000 by 1975 and by 1985, it will range between 4,300 and 7,800 with the ‘most probable’ population estimated to be about 5,400.” Predictive models of Wrangell’s future population have mixed results.
The United Nations predicts there will be 9.8 billion people in the world in 2050 — almost 2 billion more than there are today. Some of these people will certainly find their way to Wrangell and write the next chapter of the town’s history. Wrangell’s population has survived a lot and adapted with the times.